In the previous post, the Unicorn emulation framework was used to examine 2 very small programs that were both less than 100 bytes in size. Some of the fields of these binaries’ ELF headers contained executable code, which had the effect of corrupting the ELF header. Tools like radare2 and gdb could not be used to analyze the runtime behaviour of these programs. Emulation via Unicorn was shown to be a useful alternative for this task. Here, a slightly larger and more functional program with a malformed ELF header will be analyzed, this time with the new and very cool Qiling emulation framework, which is built upon Unicorn. In addition, it will be shown how a simple control-flow graph can be built from disassembly, as well as how to create a graph that maps the execution paths of a program when it is emulated.
Overview
The following will be discussed:
- creating a CFG using Captstone and Graphviz
- creating a CFG using radare2
- visualizing a trace of a binary produced via emulation with Qiling
Tools:
- Qiling
- Capstone
- Graphviz
- radare2
- pyelftools
A Very Small Hexdump
At 202 bytes, this program - also from muppetlabs [1] - is somewhat larger than the the programs in the previous post:
$ hexdump -C hexdump
00000000  7f 45 4c 46 01 01 01 00  00 00 00 00 00 00 00 00  |.ELF............|
00000010  02 00 03 00 01 00 00 00  36 00 5b 4b 2c 00 00 00  |........6.[K,...|
00000020  00 00 00 00 00 00 00 00  34 00 20 00 01 00 00 00  |........4. .....|
00000030  00 00 00 00 00 00 5b 4b  7e 1b 5b 3d ca 00 00 00  |......[K~.[=....|
00000040  eb 0a 00 00 07 00 00 00  00 10 00 00 5b b0 05 cd  |............[...|
00000050  80 09 c0 78 58 50 bf 00  01 5b 4b 57 b1 33 b0 20  |...xXP...[KW.3. |
00000060  f3 aa 58 97 91 b2 10 5b  53 b0 03 cd 80 09 c0 7e  |..X....[S......~|
00000070  3c b3 01 60 91 96 89 e8  8d 56 82 ff d2 95 b2 ba  |<..`.....V......|
00000080  ff d2 b0 3a aa 01 df 83  f3 01 ac 40 3c 20 7f 04  |...:.......@< ..|
00000090  c6 46 ff 2e 48 ff d2 e2  ec c6 06 0a 61 b1 00 8d  |.F..H.......a...|
000000a0  50 34 01 c5 b0 04 cd 80  09 c0 91 7d a9 f7 d8 93  |P4.........}....|
000000b0  31 c0 40 cd 80 52 42 c1  c0 08 d4 10 e8 00 00 00  |1.@..RB.........|
000000c0  00 86 c4 3c 0a 1c 69 2f  aa c3                    |...<..i/..|
000000ca
However, in spite of its
very small size, and unlike the tiny-i386 program from last time, this program does do something useful: it functions as a very
minimalist hexdump-like utility, as its name indicates. The program takes input from stdin and outputs a hex dump to stdout:
The ELF header is once again malformed; we can see from the output of readelf that the start of the program header table overlaps with the ELF header:
$ readelf -h hexdump
ELF Header:
  Magic:   7f 45 4c 46 01 01 01 00 00 00 00 00 00 00 00 00
  Class:                             ELF32
  Data:                              2's complement, little endian
  Version:                           1 (current)
  OS/ABI:                            UNIX - System V
  ABI Version:                       0
  Type:                              EXEC (Executable file)
  Machine:                           Intel 80386
  Version:                           0x1
  Entry point address:               0x4b5b0036
  Start of program headers:          44 (bytes into file) <------- program header overlaps ELF header --\
  Start of section headers:          0 (bytes into file)                                                |
  Flags:                             0x0                                                                |
  Size of this header:               52 (bytes)           <---------------------------------------------/
  Size of program headers:           32 (bytes)
  Number of program headers:         1
  Size of section headers:           0 (bytes)
  Number of section headers:         0
  Section header string table index: 0
Fortunately, there is no need for special tools to parse the header in this case - pyelftools [2] can be used straightforwardly, and Qiling loads it without any problems.
Building CFGs from Disassembly
Disassembly with Capstone
In order to produce correct disassembly with Capstone, it is necessary to find the file offset of the program entry point.
Besides eyeballing the hex dump of the ELF header, this can be done by subtracting the address of the entry point from the load address of
the loadable segment containing the program code (typically referred to as the text segment). This is done in lines 13 - 15 of the script below.
Once the file offset of the first instruction is found, the code can be written to a buffer and then disassembled:
$ python3 disassemble_hexdump.py hexdump
0x4b5b0036:	pop	ebx
0x4b5b0037:	dec	ebx
0x4b5b0038:	jle	0x4b5b0055
0x4b5b003a:	pop	ebx
0x4b5b003b:	cmp	eax, 0xca
0x4b5b0040:	jmp	0x4b5b004c
0x4b5b0042:	add	byte ptr [eax], al
0x4b5b0044:	pop	es
0x4b5b0045:	add	byte ptr [eax], al
0x4b5b0047:	add	byte ptr [eax], al
0x4b5b0049:	adc	byte ptr [eax], al
0x4b5b004b:	add	byte ptr [ebx - 0x50], bl
0x4b5b004e:	add	eax, 0xc00980cd
0x4b5b0053:	js	0x4b5b00ad
0x4b5b0055:	push	eax
0x4b5b0056:	mov	edi, 0x4b5b0100
      .
<output snipped>
      .
Creating a CFG
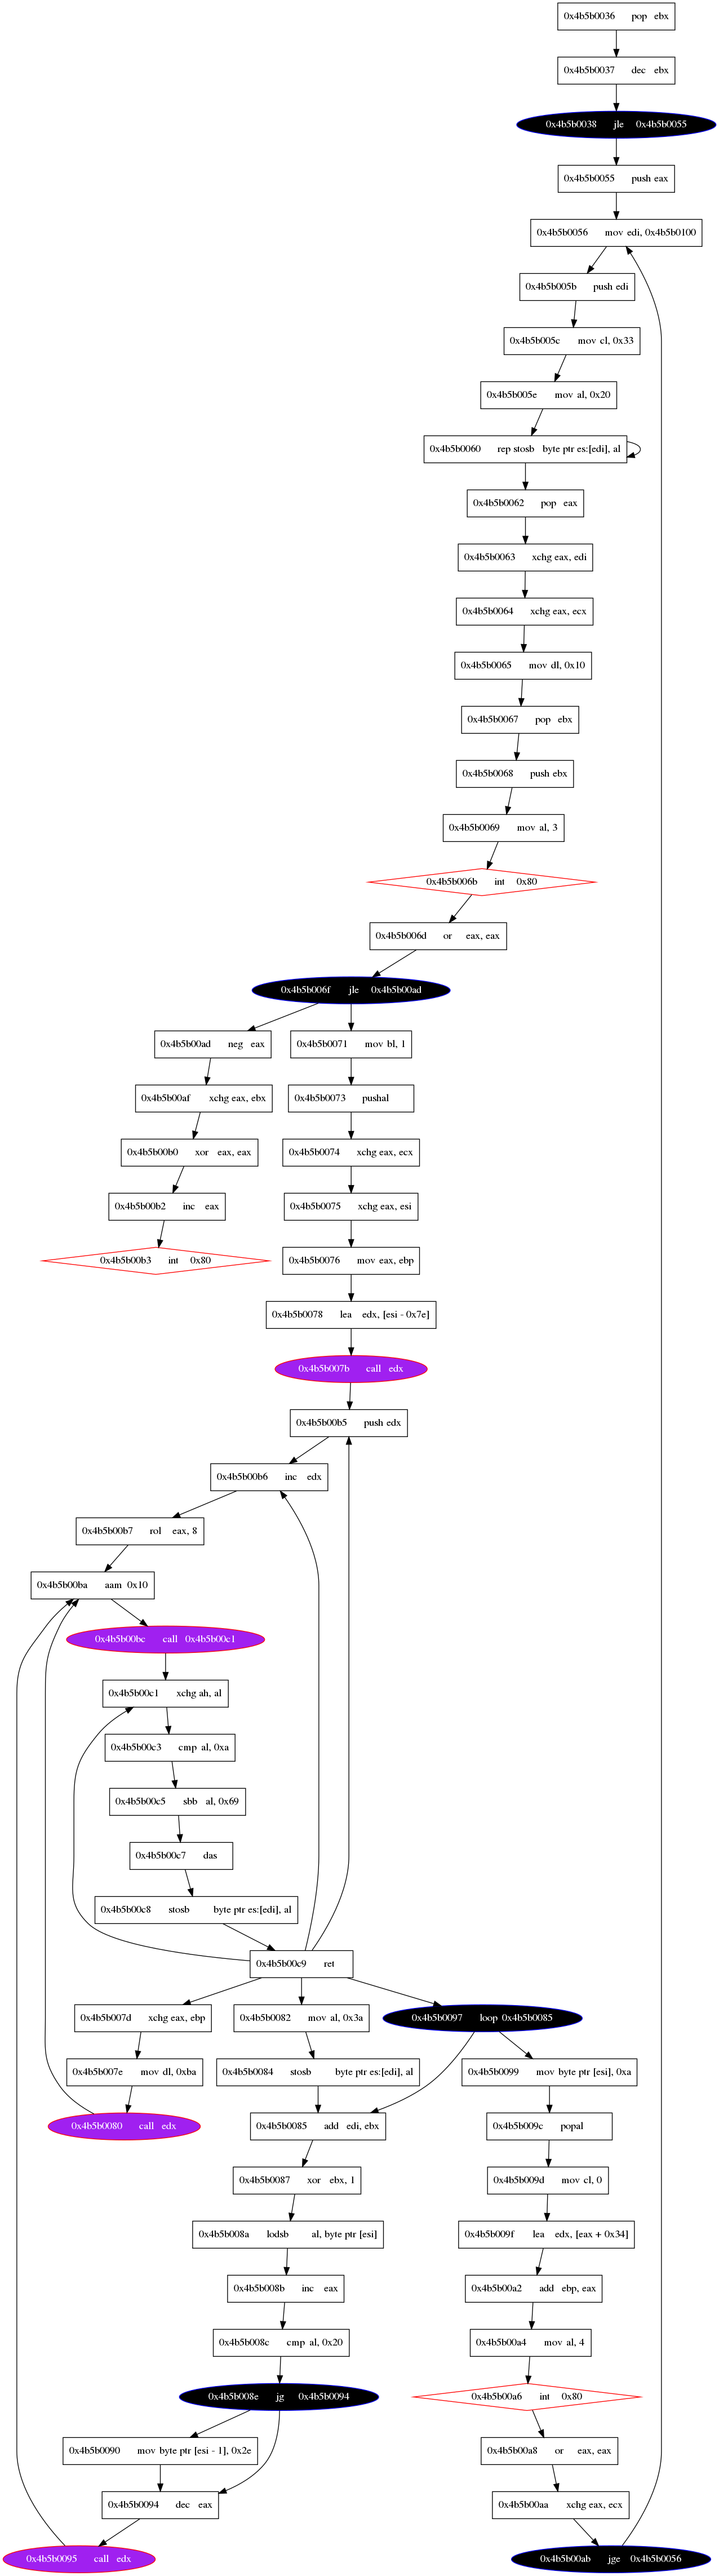
Graphviz can be used to create a simple control-flow graph of the disassembled code.
Below is a script that draws the CFG. Components of the CFG are drawn as the Capstone disassembly engine outputs disassembled instructions:
Each node represents an instruction. As such, each node consists of a memory address, a mnemonic, and an operation code. A new node is created for every intruction disassembled, and nodes are created as the code is being disassembled. After a node is created, an edge is drawn to the previously created node.
Control flow instruction nodes are black, CALL nodes are purple, and intrerrupt nodes are red diamonds. CALL nodes are highlighted even though
they do not influence the layout of the CFG because these instructions are significant during emulation and program runtime.
The accuracy of this CFG can be checked by comparing it to the one produced by radare2, which turns out to be quite similar. The disassemblies are not identical, however, which will be discussed below.
Visualizing the Disassembly with radare2
Here radare2 can be used together with graphviz to create a CFG in the following way:
$ r2 hexdump
Warning: Cannot initialize section headers
Warning: Cannot initialize strings table
Warning: Cannot initialize dynamic strings
[0x4b5b0036]> aa
[x] Analyze all flags starting with sym. and entry0 (aa)
[0x4b5b0036]> agd > r2_hexdump_graph.dot
[0x4b5b00ad]> !!dot -Tpng -o r2_hexdump_graph.png r2_hexdump_graph.dot
[0x4b5b00ad]>
CFG:
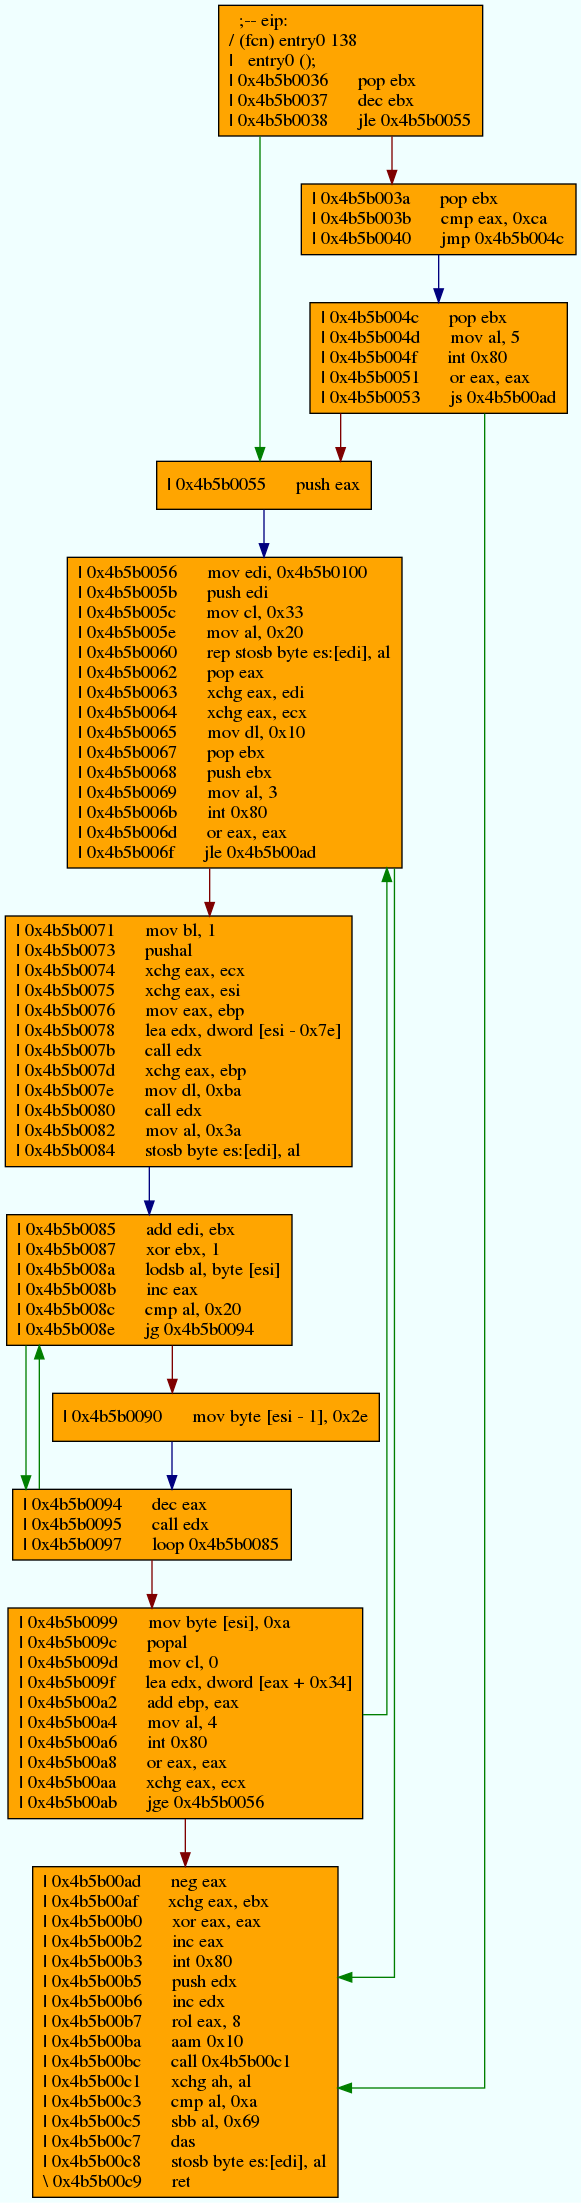
When we compare this CFG with the simpler one created using Capstone, we can see that they are very similar. The analysis performed by r2 allows for the creation of a more sophisticated CFG, in which instructions are grouped into basic blocks.
One difference between the diasassembly produced by Capstone and the disassembly producde
by radare2 can be observed at address 0x4b5b0040, in which there is a jmp either
to 0x4b5b004c or 0x4b5b0042. In the disassembly output by Capstone, 0x4b5b004c is a leaf node, indicating that there is no further reference to that address
in the rest of the disassembly. In contrast, this address is the start of a basic block containing an
interrupt in the disassembly output by radare2. This difference in disassemblies serves to highlight a difference between disassembly via linear-sweep (Capstone) and
disassembly via recursive traversal (radare2); in the disassembly output by Capstone, the jmp to 0x4b5b004c is not explored by the disassembly engine since
it disassembles bytes it takes as input without additional analysis, whereas the radare2 disassembler follows flow of control down that path,
continuing to disassemble along the way.
Emulation with Qiling
Now that we familiar with the disassembly, we can use emulation to better understand the runtime behavior of the program. Qiling [3] makes this extremely easy, since it is no longer necessary to manually implement the system services utilized by the program like it was when using Unicorn. It is as straightforward as setting up the emulation engine, hooking the code, and passing the disassembly engine object to the code hook to print disassembly as intstructions are being emulated.
When executed, disassembly should be output to stdout:
One approach to creating a graph of the emulated code is piping the output of the emulation into a log file and then creating nodes and edges from the logged instructions.
It should be noted that that input from stdin is sometimes
written to the same line as an instruction in the log file, so some preprocessing of the log file may be necessary.
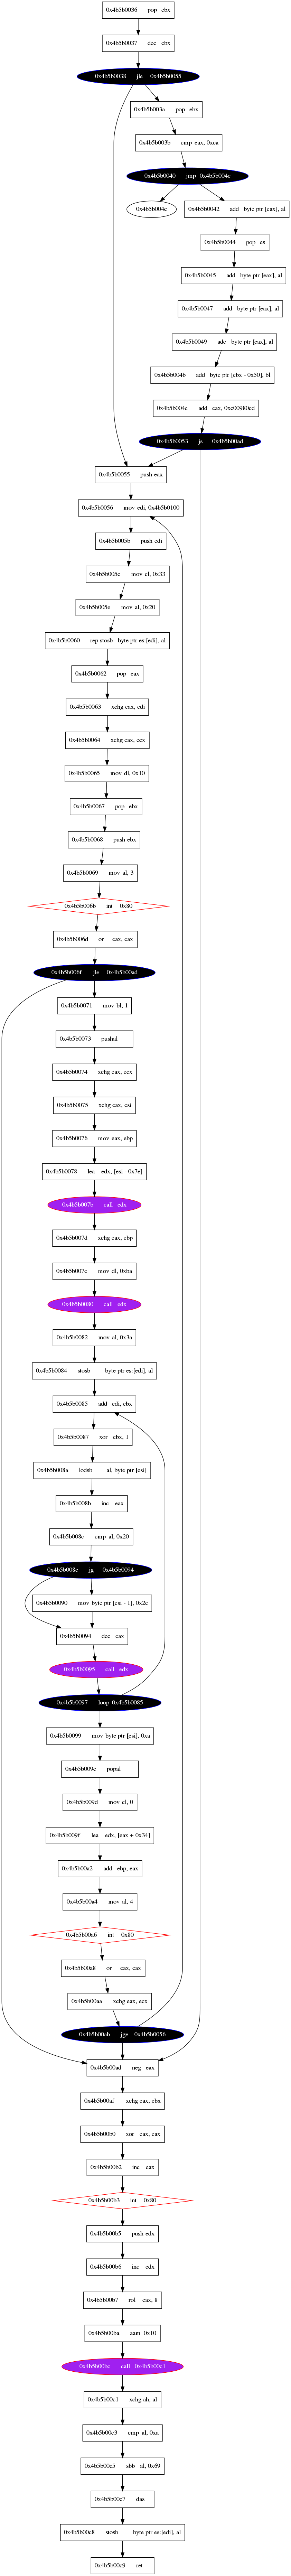
This maps the paths taken within the code when the program was emulated:
This is clearly different from the CFGs produced from the disassembly and a nice supplement. In fact, a map of the emulated flow of control may at times be more useful for understanding program runtime behavior than CFGs built from disassembly, since it will show which paths were actually taken rather than all possible paths.
Conclusion
Emulation is a useful tool for analyzing binaries when other tools do not work, or if one wishes to gain an insight into the functionality and behavior of a program without executing it. Qiling makes this easier than ever. Logged instructions from an emulation session can be used to visualize program behavior, and this can be compared with CFGs created from disassembly to better understand the program.